Urban Expansion Trends: Casino Projects Reshaping Infrastructure and Entertainment Income Distribution
Felix Flores · Aug 4, 2026
Urban Expansion Trends: Casino Projects Reshaping Infrastructure and Entertainment Income Distribution
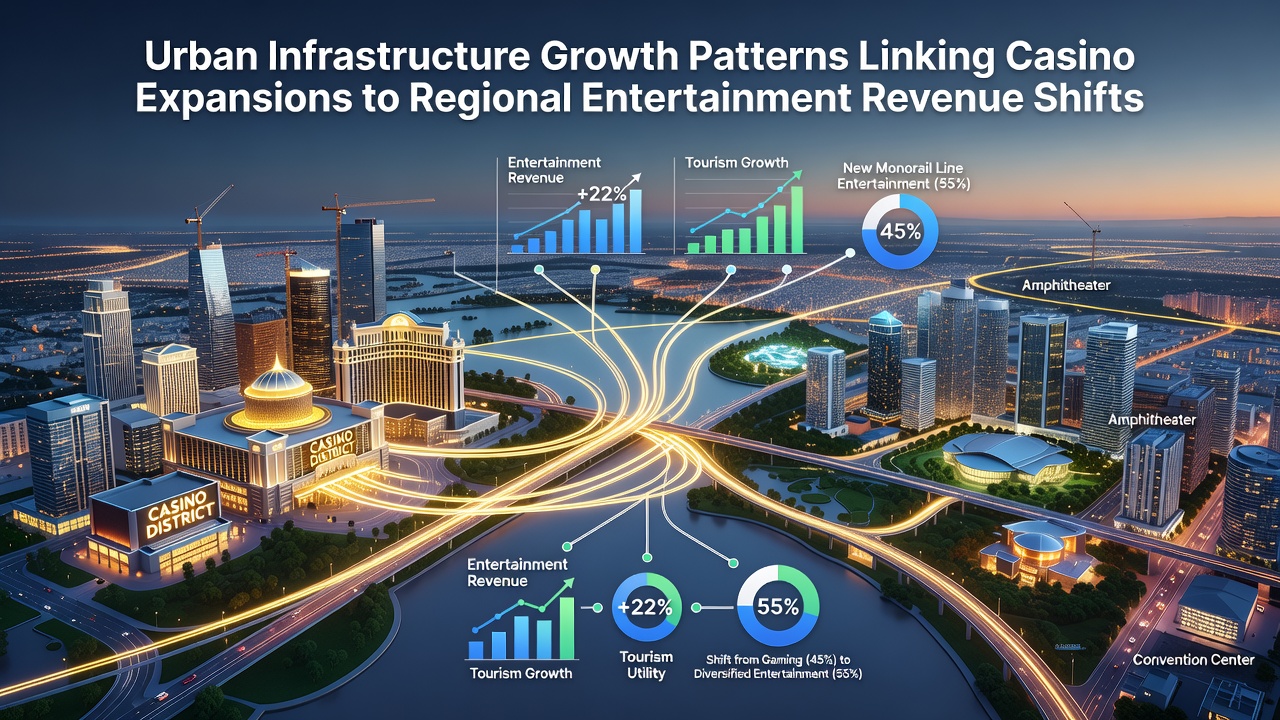
City planners and economic analysts track how casino developments trigger coordinated infrastructure upgrades, and these projects often coincide with measurable changes in how regional entertainment dollars flow across different venues and districts. Data from multiple jurisdictions shows that casino site selections frequently align with planned highway extensions, utility grid reinforcements, and public transit additions, creating feedback loops that alter spending patterns at nearby restaurants, theaters, and sports facilities.
Infrastructure Investment Patterns Around Casino Sites
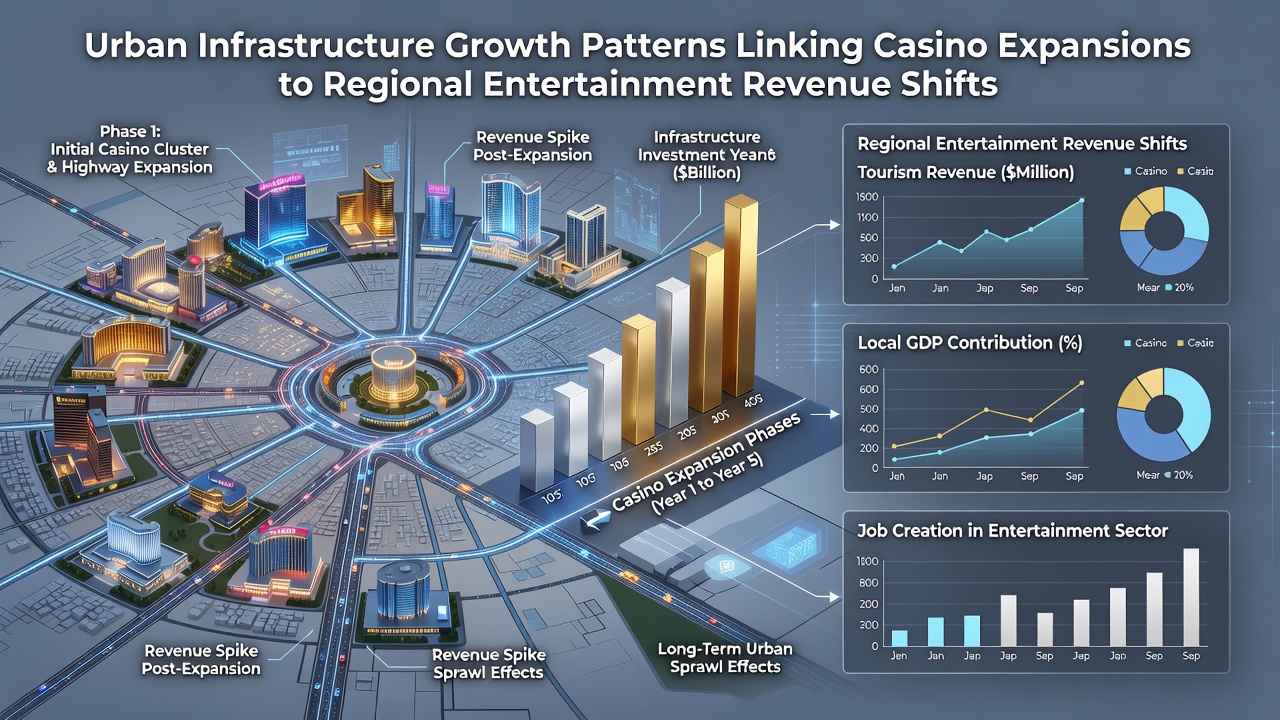
Developers typically secure permits only after committing funds to surrounding road widenings and sewer capacity increases, while municipal budgets allocate matching dollars for lighting, signage, and parking structures that serve both casino visitors and local commuters. Researchers at several universities have mapped these sequences across North American markets and found that casino openings accelerate completion of multi-year capital projects by two to four years on average, because private investment offsets public borrowing needs.
Utility providers report parallel surges in electricity and water demand forecasts once casino footprints exceed 200,000 square feet, prompting earlier upgrades to substations and treatment plants that later benefit adjacent commercial zones. Observers note that these coordinated builds reduce the risk of service interruptions during peak seasons, and the resulting infrastructure often supports additional non-gaming businesses that open nearby within eighteen months.
Revenue Reallocation Across Entertainment Sectors
Regional spending data indicates that casino expansions capture a growing share of discretionary entertainment budgets, yet total market size sometimes expands when new visitor traffic spills into surrounding hotels and performance spaces. Figures released by state gaming agencies reveal that counties hosting major casino projects record a 12 to 18 percent rise in combined hospitality and amusement tax collections during the first three years after opening, while standalone movie theaters and concert halls within a 30-mile radius experience variable outcomes depending on programming overlap.
One longitudinal study covering properties opened between 2018 and 2024 documented how live-event venues located near casino corridors adjusted ticket pricing and show schedules to compete for overlapping audiences, and many reported stable or increased attendance once transportation improvements shortened travel times. Meanwhile, independent restaurants farther from the new infrastructure corridors sometimes recorded slower growth, illustrating how proximity to upgraded roadways influences where consumers choose to spend.
Geographic and Temporal Variations in August 2026
August 2026 reports from multiple regulatory bodies highlight ongoing projects in secondary markets where older riverboat casinos transition to land-based facilities, and each relocation coincides with new arterial road construction plus expanded convention-center capacity. These moves often follow extended negotiations that tie gaming license renewals to specific infrastructure milestones, creating predictable timelines that local governments use for budgeting and workforce planning.
Analysts tracking quarterly revenue filings note that entertainment sectors outside casino clusters maintain steady performance when they differentiate offerings, such as family-oriented attractions or niche cultural programming that does not directly compete with casino floor shows. In contrast, venues offering similar late-night experiences show more pronounced revenue compression until transportation networks fully integrate the expanded casino zone with surrounding neighborhoods.
Policy Frameworks Guiding Coordinated Growth
Planning departments increasingly require casino operators to submit traffic-impact studies and utility-demand projections before ground-breaking, and these documents shape the sequencing of public works that later serve broader community needs. According to data compiled by the American Gaming Association, jurisdictions that embed such requirements within licensing agreements achieve faster completion rates for shared infrastructure while maintaining oversight on cost allocation between private and public sources.
International comparisons drawn from markets in Australia and Canada show similar patterns, where gaming regulators coordinate with transport ministries to align casino expansions with rail extensions and airport capacity increases. These joint frameworks reduce duplication of effort and produce more accurate forecasts of visitor volumes that inform both casino design and regional entertainment marketing strategies.
Conclusion
Long-term monitoring of urban metrics demonstrates that casino expansions function as catalysts for infrastructure renewal, and the resulting changes redistribute entertainment revenue streams in patterns that reward venues located near upgraded transit corridors while challenging those farther afield. Continued data collection through 2026 and beyond will clarify how these linkages evolve as additional markets complete current development cycles.