Progressive jackpot networks reveal payout frequency patterns that correlate with shifts in user engagement metrics across digital platforms
Zara Keller · Aug 11, 2026
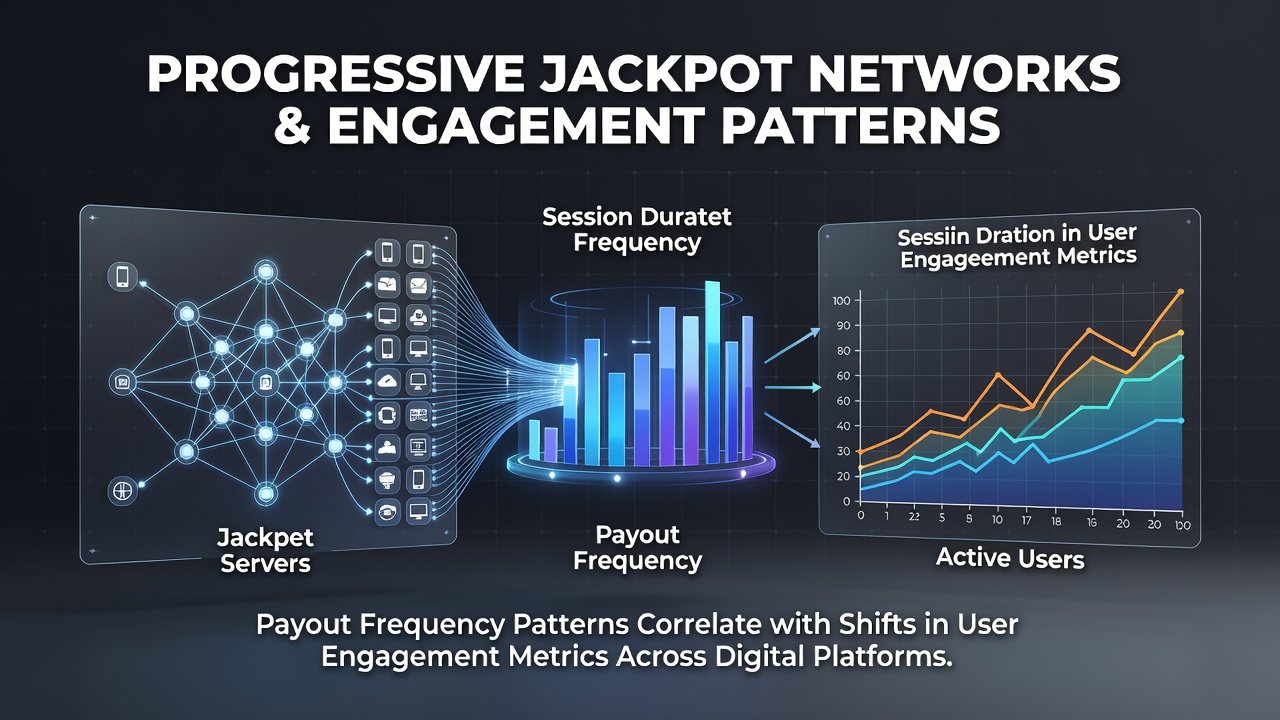
Progressive jackpot networks reveal payout frequency patterns that correlate with shifts in user engagement metrics across digital platforms
Progressive jackpot networks operate across multiple digital platforms where interconnected slot games contribute to growing prize pools, and recent analyses show distinct payout frequency patterns emerging in relation to user engagement metrics. These networks pool contributions from players worldwide, which creates larger jackpots that trigger at irregular intervals depending on total bets placed and platform activity levels. Data collected from major operators indicates that payout events cluster during periods of elevated login rates and session durations, while quieter intervals see fewer hits even as jackpot sizes continue to climb.
Network mechanics and data collection methods
Operators track every wager across linked games through centralized systems that monitor contribution rates and trigger conditions in real time. When a jackpot hits, the system resets the pool and begins accumulation again, yet the timing of these resets aligns with broader activity spikes rather than random chance alone. Studies from research institutions reveal that platforms using shared progressive structures record higher average session lengths immediately after major payouts, and this pattern holds across both desktop and mobile interfaces.
August 2026 brought additional clarity to these trends as several networks released aggregated reports covering the first half of the year. Those reports highlighted how payout intervals shortened during months with strong promotional campaigns, and engagement metrics such as daily active users rose in tandem. The correlation appears strongest on platforms that display current jackpot amounts prominently, which draws repeat visits from users monitoring pool growth.
Observed patterns in payout timing and engagement shifts
Frequency data shows that jackpots paying out between 8 PM and midnight local time coincide with peak engagement windows across multiple time zones, while early morning hours produce fewer triggers despite steady contributions. This timing relationship holds because more players are active during evening blocks, which accelerates the rate at which the required bet threshold is reached. Observers note that user retention curves flatten after extended dry spells between payouts, and platforms respond by adjusting marketing pushes to re-engage dormant accounts.
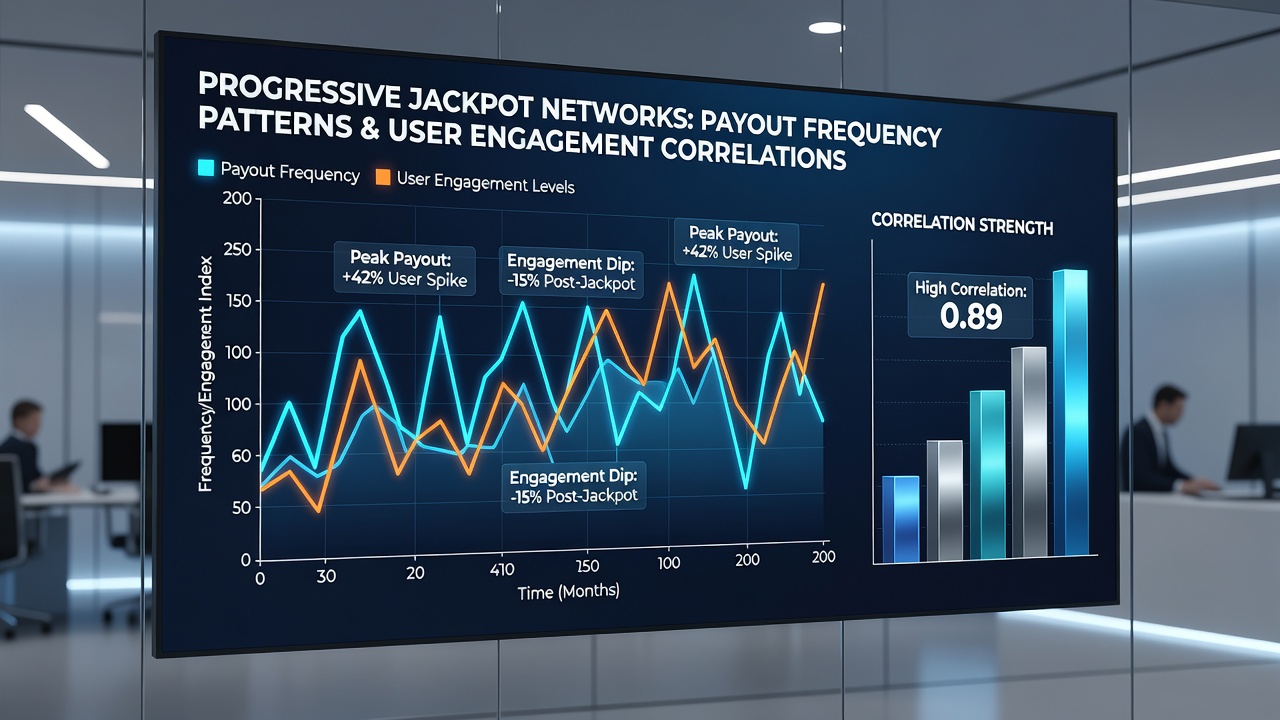
One analysis of North American platforms found that a 15 percent rise in concurrent users preceded jackpot triggers by an average of 48 hours, and similar patterns appeared in European and Asian markets. These findings come from cross-referenced server logs rather than player surveys, which reduces self-reporting bias. When payouts occur, subsequent weeks often register sustained increases in deposit activity and time spent per session, though the effect diminishes if the next jackpot takes unusually long to hit.
Regional regulatory perspectives and industry monitoring
According to figures from the Alcohol and Gaming Commission of Ontario, digital gaming sites under its oversight reported consistent alignment between payout events and weekly engagement reports throughout 2025 and into 2026. Meanwhile, data released by the Pennsylvania Gaming Control Board tracked how progressive contributions from in-state users fed into larger interstate pools, and those contributions correlated with measurable upticks in weekly active accounts. Both agencies require operators to maintain detailed logs that allow for such pattern identification without compromising individual player privacy.
Industry groups have begun sharing anonymized datasets to help identify whether certain payout rhythms produce more stable engagement than others. This collaboration focuses on technical metrics such as average bets per session and churn rates rather than promotional claims. The result is a growing body of evidence that networks can fine-tune visibility settings for jackpot meters to smooth out engagement fluctuations across different player segments.
Conclusion
Progressive jackpot networks continue to generate measurable connections between payout frequency and user engagement metrics, and ongoing data collection supports further refinement of these observations. As platforms expand their tracking capabilities, the patterns identified in 2026 provide a baseline for understanding how jackpot structures influence player behavior across digital environments. Regulatory bodies in multiple regions maintain oversight of these systems, which ensures that reported correlations rest on verified operational records rather than speculation.